COVID-19 (2019-nCoV) real time dashboard ↦
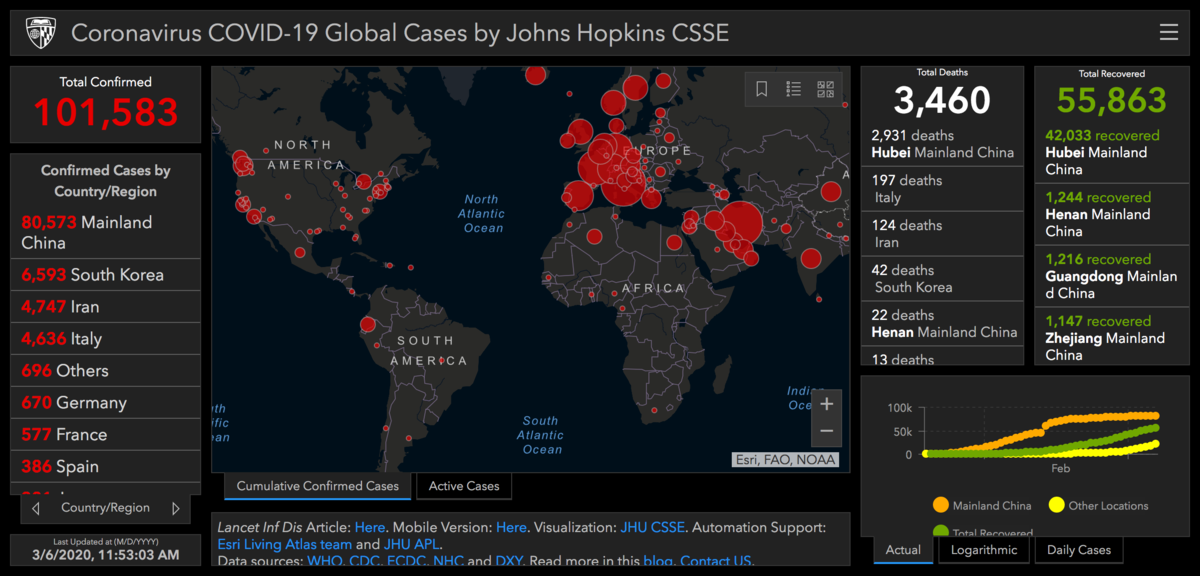
This interactive dashboard was created by the Center for Systems Science and Engineering (CSSE) at Johns Hopkins University to visualize and track reported cases of coronavirus disease 2019 (COVID-19) in real time. The data collected and displayed are freely available on GitHub.
Below are a few notable pull-quotes from this correspondence on The Lancet’s Infectious Diseases journal.
The dashboard, first shared publicly on Jan 22, illustrates the location and number of confirmed COVID-19 cases, deaths, and recoveries for all affected countries. It was developed to provide researchers, public health authorities, and the general public with a user-friendly tool to track the outbreak as it unfolds.
The dashboard reports cases at the province level in China; at the city level in the USA, Australia, and Canada; and at the country level otherwise. During Jan 22–31, all data collection and processing were done manually, and updates were typically done twice a day, morning and night (US Eastern Time). As the outbreak evolved, the manual reporting process became unsustainable…
Given the popularity and impact of the dashboard to date, we plan to continue hosting and managing the tool throughout the entirety of the COVID-19 outbreak and to build out its capabilities to establish a standing tool to monitor and report on future outbreaks.
For more updates and resources follow Lauren Gardner on Twitter or read the readme.
Discussion
Sign in or Join to comment or subscribe